
In this project, I utilized a dataset of employee information to analyze attrition patterns and develop insightful visualizations. By exploring various factors such as attrition by department, gender, age group, and education level, I aimed to provide valuable insights into attrition trends and identify areas where the organization can improve employee retention strategies. The following is a description of the steps I took in conducting the analysis, a showcase of the dashboard, and a discussion of insights I drew from the project.
Description of steps taken:
- Data Acquisition and Preparation:
- Downloaded the dataset and loaded it into the project.
- No data cleaning actions were instituted since data were already clean.
- KPI Visualization:
- Created a KPI sheet to provide an overview of the total number of employees in the organization.
- Tracking Employee Attrition:
- Introduced a calculated field using an if-else statement to identify employees who have left the company.
- Created a second calculated column to calculate the attrition rate by dividing the count of employees who left by the total employee count.
- Generated another calculated column to determine the number of active employees by subtracting the attrition count from the total employee count.
- Document-Level Filter:
- Implemented a document level filter based on education level to apply consistent filtering across the entire project.
- Gender-Based Attrition Distribution:
- Implemented various actions to construct a custom chart, specifically a lollipop chart, to depict the distribution of attrition by employee gender.
- Attrition Analysis by Department:
- Utilized a pie chart with labels to visualize the attrition levels within different departments.
- Age Group Analysis:
- Created custom age bins from the age variable and utilized a column chart to display the attrition counts for each age group.
- Implemented interactivity, allowing users to adjust the age bins to explore different age groups dynamically.
- Job Satisfaction Analysis:
- Developed a heatmap to illustrate the distribution of employees with varying levels of job satisfaction across different roles in the organization.
- Education Level and Attrition:
- Utilized a bar chart to visualize the attrition counts based on employee education level.
- Attrition Analysis by Age and Gender:
- Developed a custom chart, specifically a donut chart, to showcase the attrition counts based on age band and gender of employees.
- Dashboard Setup:
- Applied a pre-developed dashboard background and adjusted the page size to align with the selected design.
- Transferred the various visualizations to the dashboard, ensuring proper formatting and editing to enhance the overall presentation and user experience.
Click below to view the dashboard on Tableau Public:
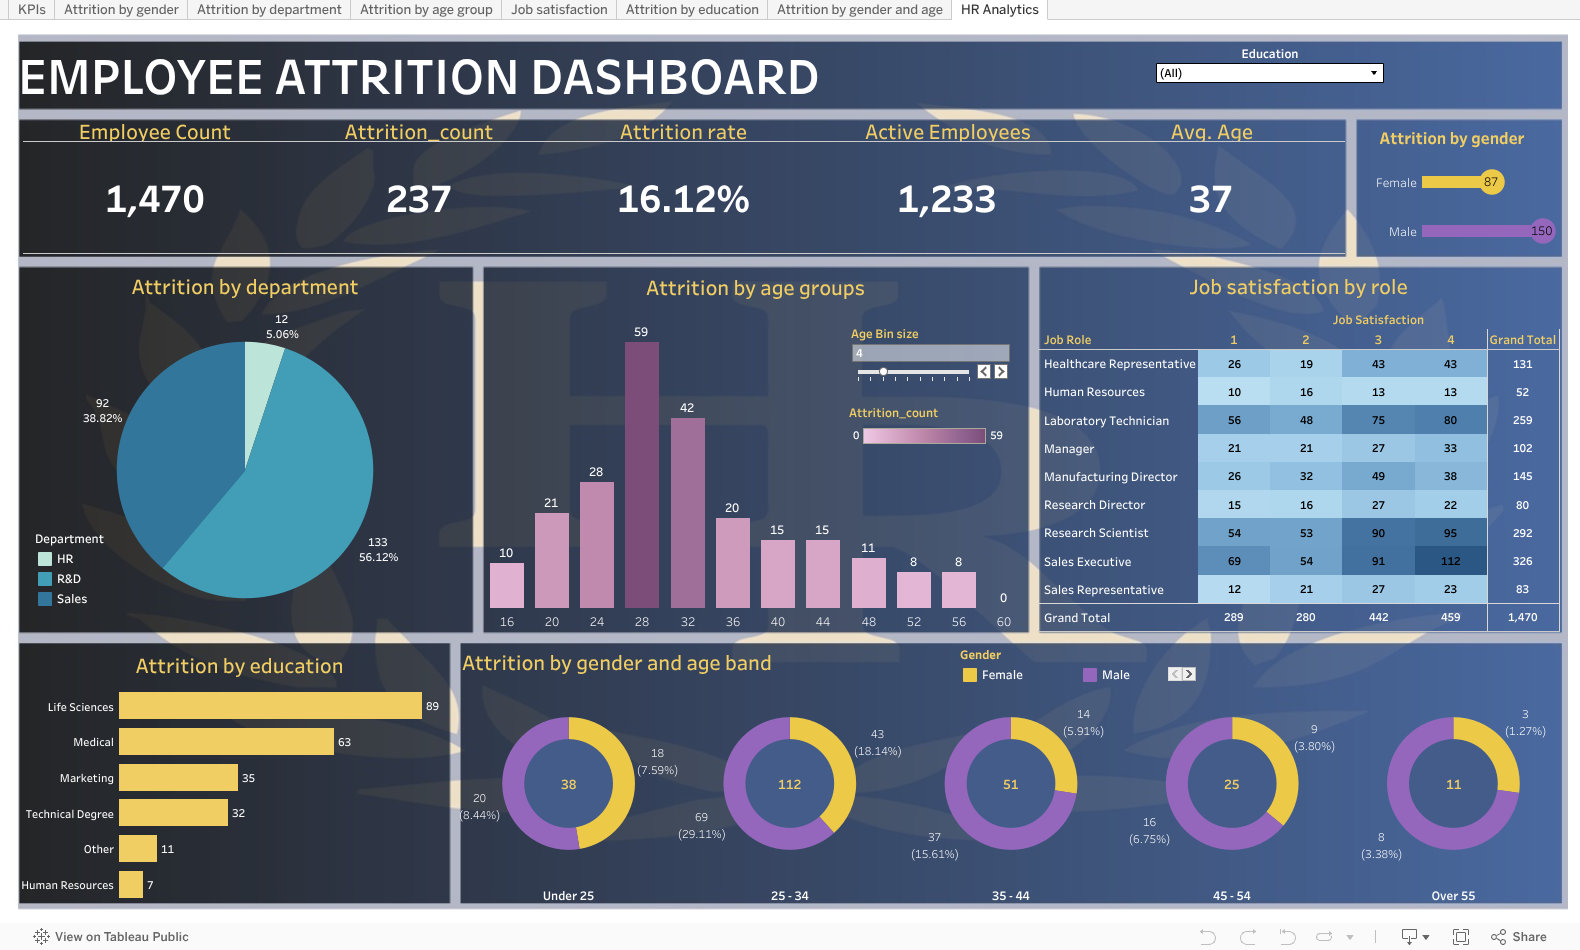
The following insights are apparent:
- Department-wise Attrition:
- The analysis revealed that the R&D department experienced the highest attrition rate among all departments, indicating potential areas of improvement in employee retention strategies within that department.
- The sales department also had a significant attrition rate, suggesting a need to focus on enhancing employee engagement and satisfaction in sales roles.
- Interestingly, the HR department exhibited relatively low attrition, which could imply that HR practices and policies implemented within the organization are effective in retaining employees.
- Overall Attrition Rate and Gender:
- The overall attrition rate of approximately 16% indicates a significant proportion of employees leaving the organization.
- The majority of employees who left the company were male. This gender disparity in attrition rates could indicate the need to examine potential factors influencing attrition specifically among male employees, such as career advancement opportunities, work-life balance, or job satisfaction.
- Age Group Analysis:
- The analysis highlighted that the 28-34 age group had the highest attrition rate. This finding suggests the importance of paying attention to the specific needs and motivations of younger employees to reduce attrition.
- On the other hand, older employees demonstrated lower attrition rates. This could be attributed to factors like stability, job tenure, and potentially stronger ties to the organization.