Introduction
In the wake of the unprecedented COVID-19 pandemic, humanity witnessed the remarkable mobilization of scientific innovation, global collaboration, and the indomitable spirit of resilience. The battle against the virus spurred an urgent need for effective solutions, leading to the development of vaccines at an astonishing pace. As the world rallied to combat the pandemic, the significance of tracking global vaccines was crucial for progress measurement.
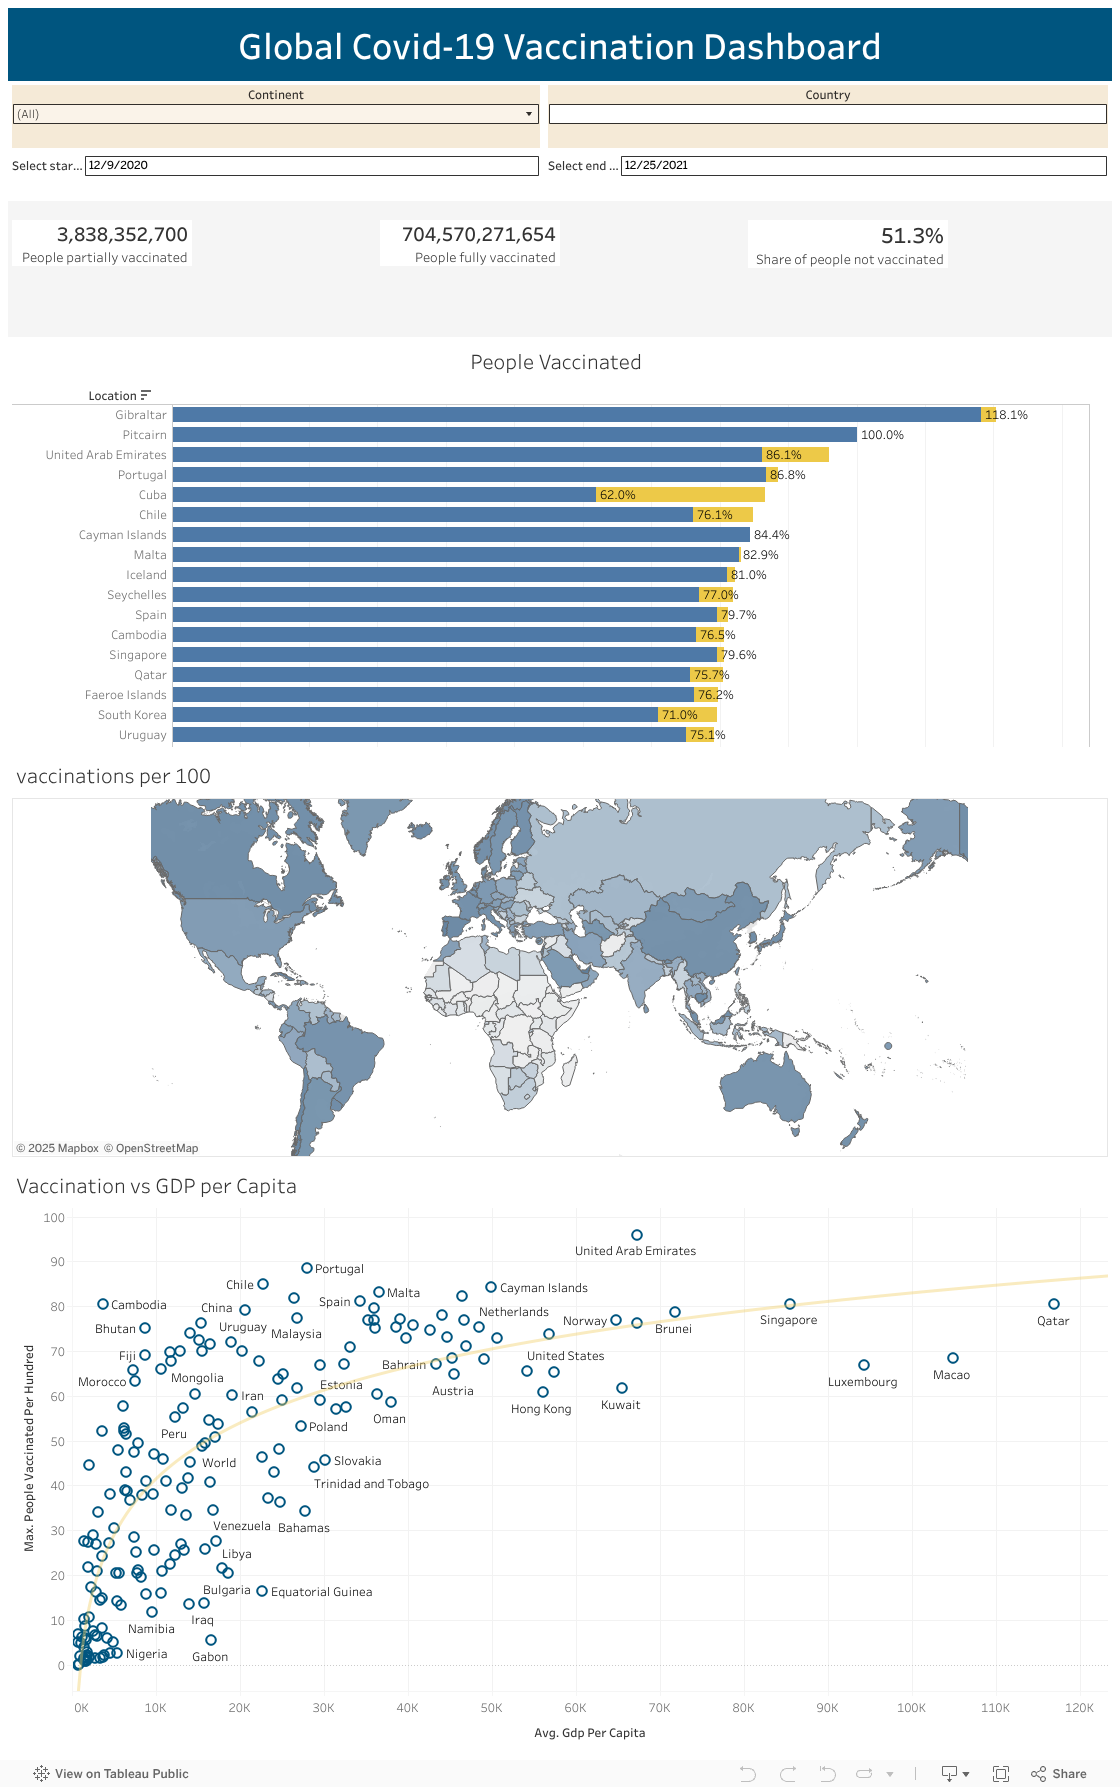
In this tableau project, I harnessed the power of data visualization to present a dynamic dashboard that captures the journey of global COVID-19 vaccinations. Through interactive charts, a map, and insights, the aim was to provide a visual narrative of the vaccination landscape. By translating complex data into easily understandable visuals, we can have a broader understanding of the pandemic’s trajectory and the critical role of vaccines in ending the pandemic.
As you explore this dashboard, you will witness the vaccination rates across different countries and continents over time. The project used a cleaned dataset, and a few calculated columns to develop the dashboard. Filters allow the reader to discover vaccination progress by country and by continent, as well as checking vaccination rates by date.