Description of the problem
You have been approached by the organizers of a Beauty Pageant who described the difficulties they faced in last year’s contests to you. All the scoring was done manually; this caused significant delays and ran the risk of manual errors. The organizers continue to describe their requirements for a system they would like to use for this year’s show. They require a system that can let them:
- Easily input scores as the judges enter them.
- Calculate weighted scores and rankings quickly and accurately based on multiple criteria.
You instantly think a Pivot Table would do the job, and you come up with the following sketch as the organizers explain their requirements for the system in detail.
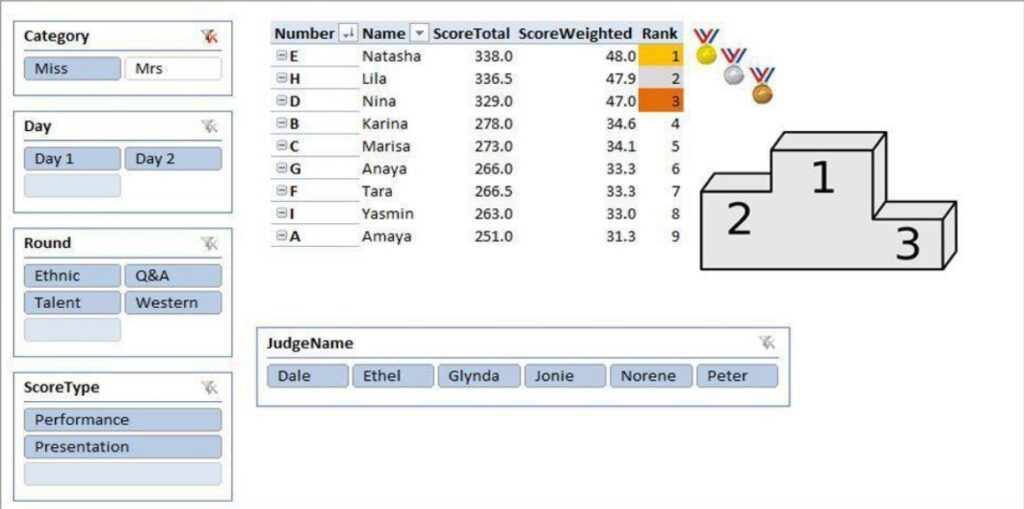
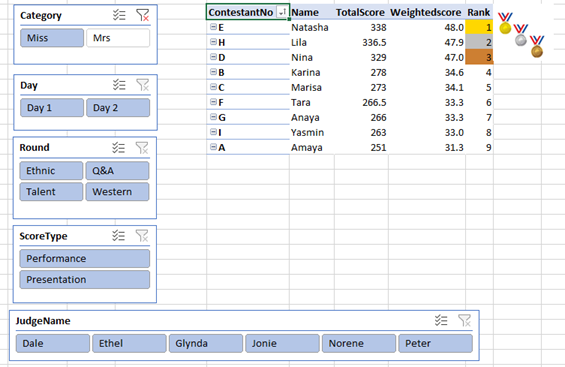
Where the pivot table has: (i) Measures: ScoreTotal, ScoreWeighted, Rank (Measures in Power Pivot are calculations used in data analysis.) (ii) Slicers: Category (Miss, Mrs), Day (Day1, Day2), Round, ScoreType (Slicersare visual filters in the form of an interactive button). It will allow the organizers to determine quickly: a) Which contestants advance to the final round? b) Who are the overall winners after the final round?
Description of the solution
The following steps were implemented in Power Query:
- Promoted all first rows to headers, to ensure that tables could be appended without any errors.
- Appended queries to concatenate the 6 tables made up of 6 judges scores, to simplify the analysis process coming later.
- Unpivoted the seven columns representing scores so as to remove the null values associated with appending data that included a column for the Q&A stage of the competition.
- Renamed the resultant “Attributes” and “Values” columns to “RoundType” and “Scores” respectively for ease of reference later.
- Changed the format of the “Scores” column to decimal numbers for proper analysis.
- Deleted the name column because it could be obtained again by constructing relationships later in Power Pivot.
- Saved and closed.
Since data had been appended to a new tab “Scoring”, I deleted the 6 tabs representing scores by the 6 judges, to ensure that the document remains small in size and allows for my computer to process it with ease.
View the project on sharepoint:
The following activities were conducted with Power Pivot:
- Activated power pivot add-on for Excel using File > Options > Add Ons.
- Added each of the four tables individually to the data model to ensure relationships can be constructed, and data analysed in one pivot table.
- I then used the data model to create a new Pivot Table.
- Fields were appropriately constructed to ensure the contestant name and number were placed on the “rows”, while the scores were placed under “values”
- While inserting the values into the data model, Power Pivot was able to auto-detect key relationships e.g., the contestant number in both the Scores and Contestants tabs were used to link the two tabs in Power Pivot.
- Two DAX formulas were introduced into the data model to help calculate the weighted scores and rank participants based on their scores:
- WeightedScore = SUMX(Scoring, Scoring[Scores]*RELATED(Rounds[Weightage])) [1]
- Rank = RANKX(AllSelected(Contestants),[WeightedScore])
[1] NB: The Rank measure was based on each participant’s weighted score, not their total score.
The following steps were taken as part of data analysis.
- Slicers were individually developed, with appropriate relationships being defined.
- I then moved slicers around for aesthetics purposes to arrange them in a visually orderly and pleasing way. I also customised the slicers by adjusting the number of rows, height, and width.
- I also removed the grand totals since they save no purpose on the table.
- I then sorted the results by rank (smallest first), to determine the winner, runner-up, and bronze medallist. Using colour formatting, I highlighted the top three performers for each of the categories “Miss” and “Mrs”, then captured the screenshots below:
Category “Miss” winners:
In the Miss category, Natasha took first place with a weighted score of 48, while Lila took second place with a score of 47.9, and Nina took third place with a score of 47.
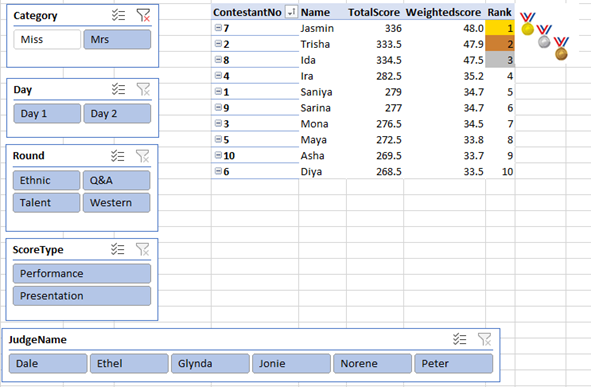
Category “Mrs” winners:
In the Mrs category, Jasmyn took first place with a weighted score of 48, while Trisha took second place with a score of 47.9, and Ida took third place with a weighted score of 47.5.